library(palmerpenguins)
library(tidyverse)
library(shiny)
library(bslib)
library(DT)


#################
### Define UI ###
#################

ui <- page_sidebar(
  title = h1("Penguins dashboard"),

  # Define sidebar inputs
  sidebar = sidebar(
    title = strong("Histogram controls"),

    # Filter by species
    selectizeInput(inputId = "spp",
                   label = "Select a species",
                   choices = unique(penguins$species),
                   selected = "Adelie",
                   multiple = TRUE
    ),


    #create dropdown selection for var on x-axis
    varSelectInput(
      inputId = "var_x",
      label = "Select x-axis",
      data = penguins,
      selected = "bill_length_mm"
    ),

    #create dropdown selection for var on y-axis
    varSelectInput(
      inputId = "var_y",
      label = "Select y-axis",
      data = penguins,
      selected = "body_mass_g"
    ),

    # Add button to download figure
    downloadButton(outputId = "save_fig",
                   label = "Download figure"),

    # Add download link for full dataset
    downloadLink(outputId = "save_data",
                 label = "Download brushed penguins dataset")

  ),

  # Main panel content
  h3("Exploration of Palmer penguins data"),

  plotOutput("biplot", brush = "plot_brush"),
  dataTableOutput("tbl")

)


#####################
### Define server ###
#####################

server <- function(input, output, session) {

  # Create reactive object for filtered penguins data
  penguins_filt <- reactive({
    penguins |>
      filter(species %in% input$spp)
  })


  ### Output in app ###

  # Create reactive object for ggplot fig
  fig <- reactive({
    ggplot(penguins_filt()) +
      geom_point(aes(!!input$var_x, !!input$var_y, color = species), size = 2, alpha = 0.75) +
      scale_color_brewer(palette = "Set1") +
      theme_bw(base_size = 20)
  })

  # Create biplot based on selected variables
  output$biplot <- renderPlot({
    fig()
  })

  # Create table from brushed points on plot
  output$tbl <- renderDataTable(
    brushedPoints(penguins_filt(), input$plot_brush),
    options = list(pageLength = 5)
  )


  ### Output to download ###

  # Code to export figure upon clicking download button
  output$save_fig <- downloadHandler(
    filename = "example_fig.png",
    content = function(file) {
      ggsave(file, plot = fig(), device = "png", width = 6, height = 4, units = "in")
    }
  )

  # Code to export data upon clicking download link
  output$save_data <- downloadHandler(
    filename = "penguins_brushed.csv",
    content = function(file) {
      readr::write_csv(brushedPoints(penguins_filt(), input$plot_brush),
                       file)
    }
  )

}


###############
### Run app ###
###############

shinyApp(ui, server)4 Input Widgets
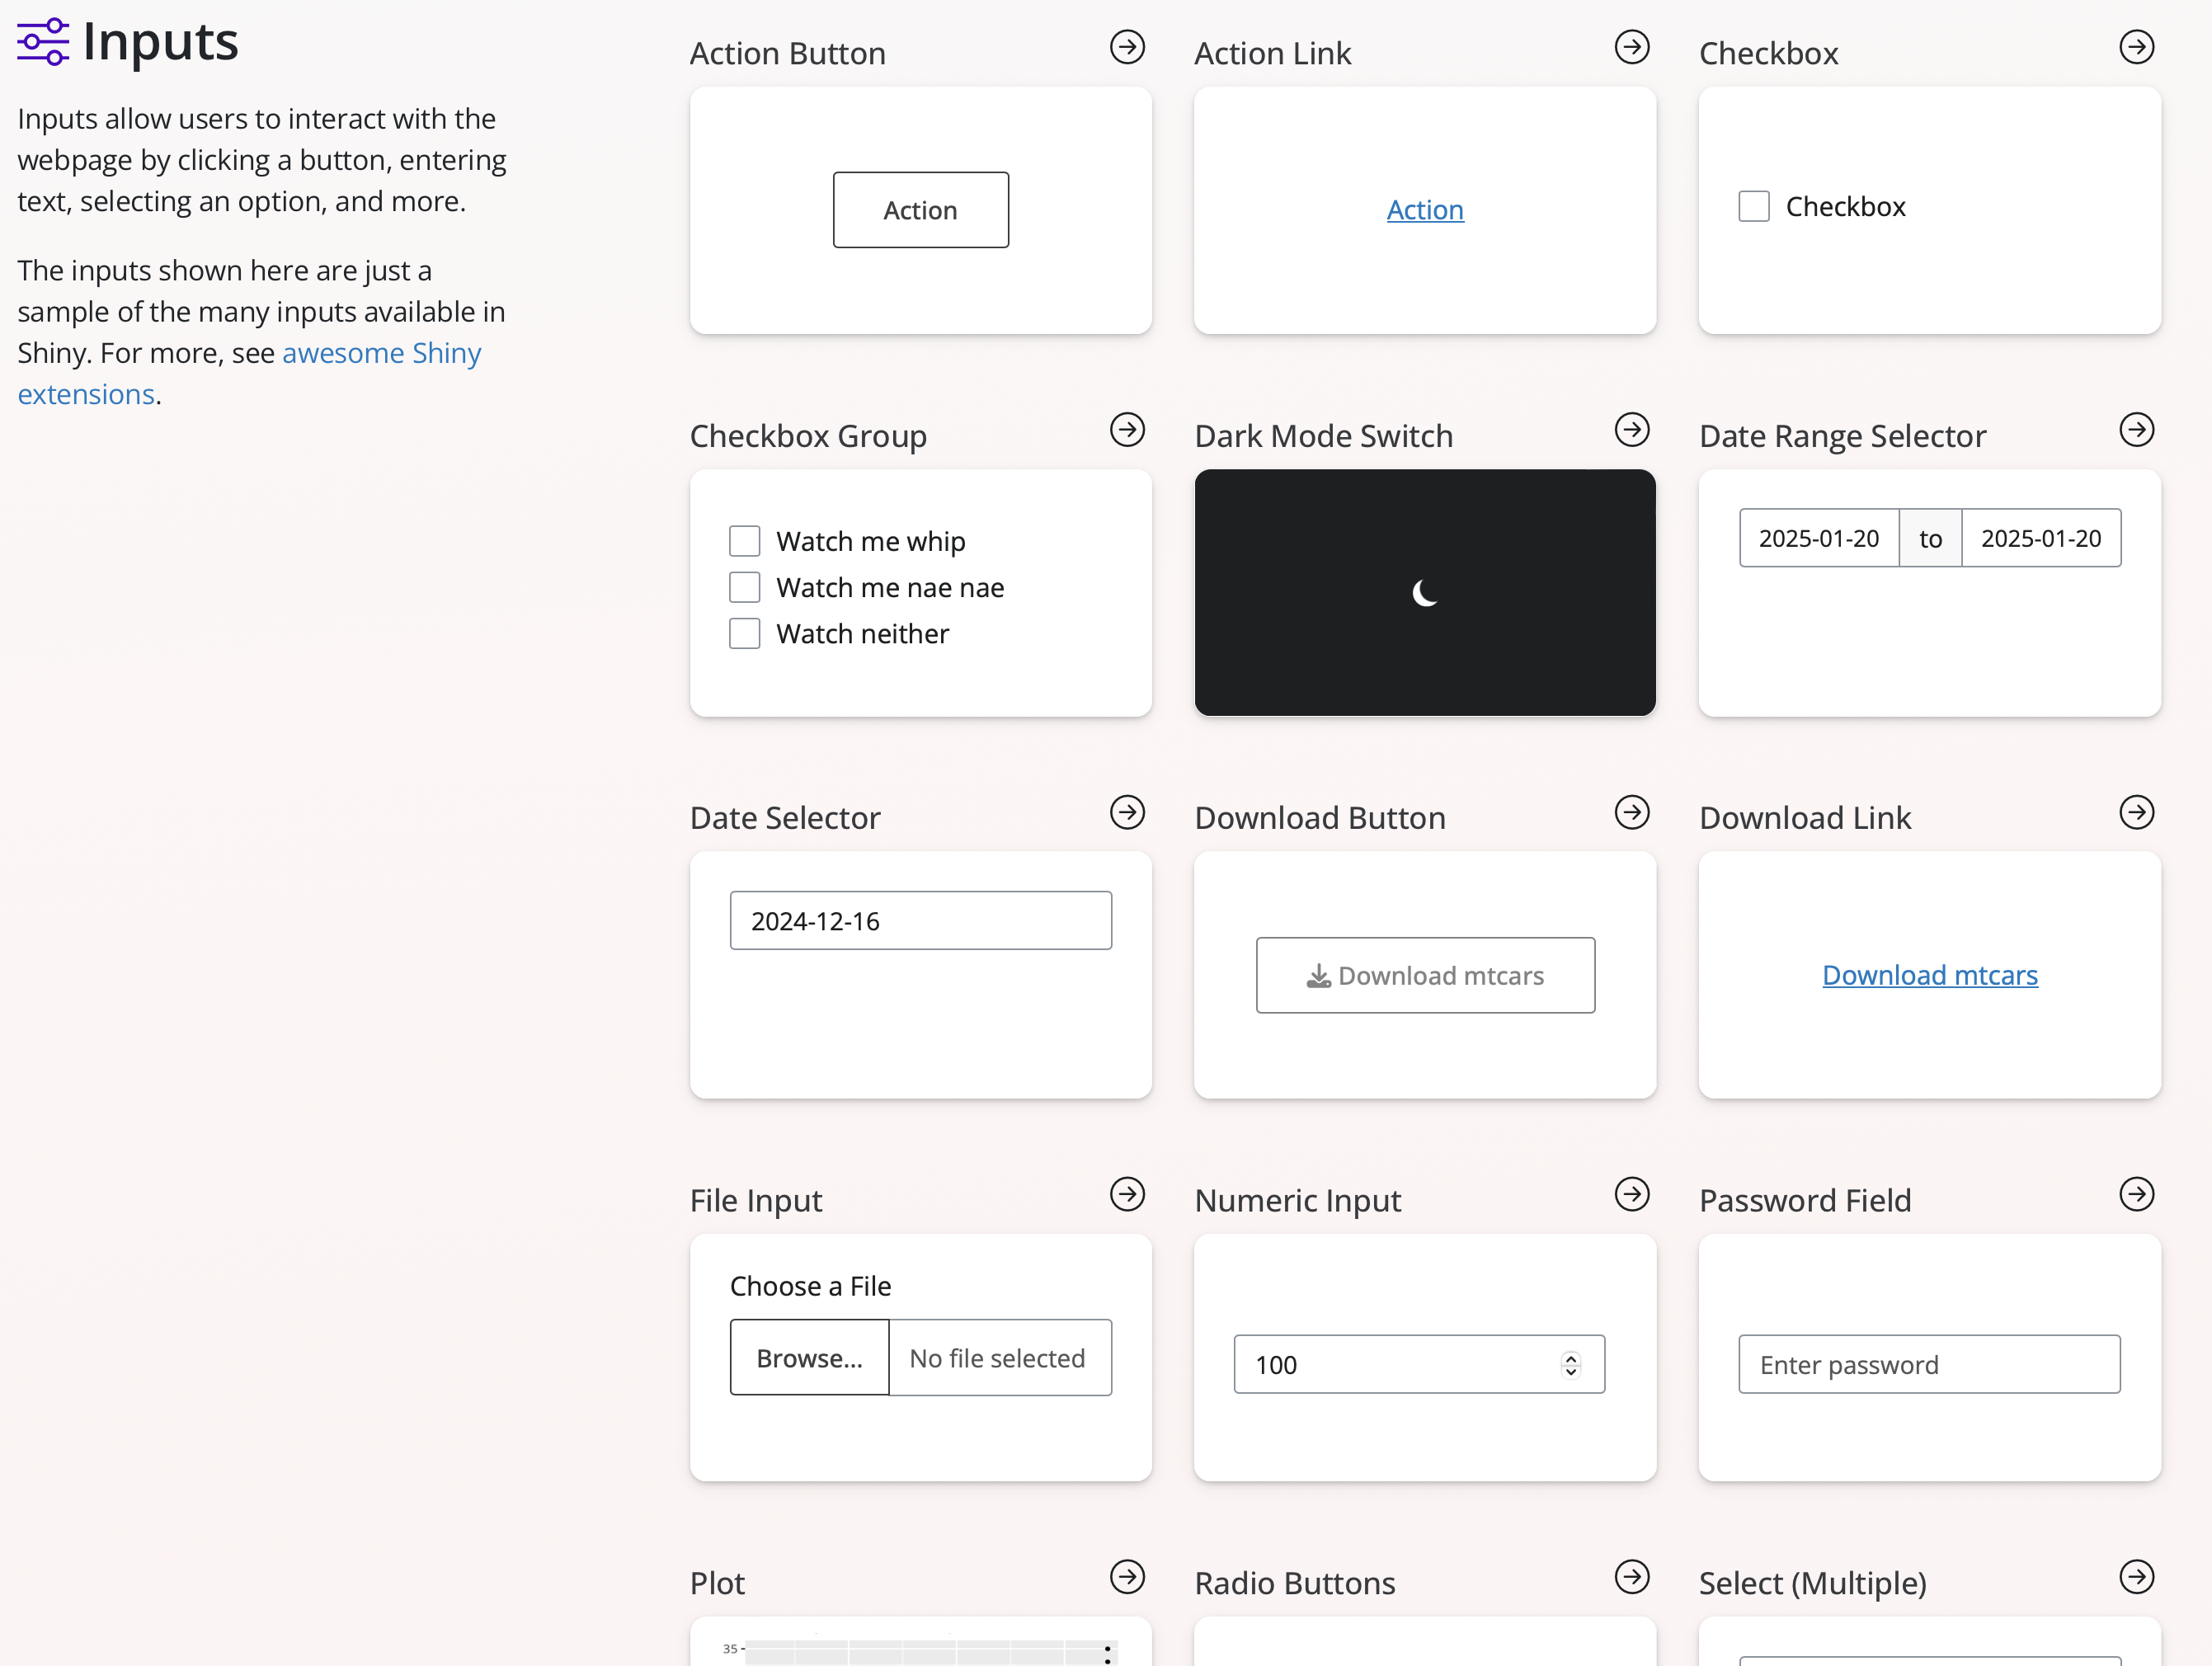
There are a wide range of different input widgets for Shiny apps, including those that were made by developers and stored in packages to extend the functionality of Shiny (e.g., shinyWidgets). An example of some of the available inputs from the {shiny} package can be seen in the screenshot below.
These inputs can be used to select numbers, dates, character strings, as well as include action buttons, toggles, and checkboxes. As mentioned in previous sections, inputs are placed within the UI section of a Shiny app, which allows the user to interact with them. Each input must be given its own ID in order to properly identify it in the server. These inputs can be customized through the text labels placed on or next to them, the color(s) of the input, as well as its size, placement and other features. While some of these attributes can be modified using the input R function arguments, others require a little knowledge of CSS classes (which is the web language for styling and aesthetics of web elements).
Additional info on Shiny inputs can be found from the Shiny for R tutorial and the Shiny components page.
Exercise 1
Using the included code:
- Change the input widget for species from a dropdown menu to checkbox group
- Add a radio button widget that also filters the penguins dataset by year (in addition to species)
library(palmerpenguins)
library(tidyverse)
library(shiny)
library(bslib)
library(DT)


#################
### Define UI ###
#################

ui <- page_sidebar(
  title = h1("Penguins dashboard"),

  # Define sidebar inputs
  sidebar = sidebar(
    title = strong("Histogram controls"),

    # Filter by species
    checkboxGroupInput(
      inputId = "spp",
      label = "Select a species",
      choices = unique(penguins$species),
      selected = "Adelie"
    ),

    # Filter by year
    radioButtons(
      inputId = "year",
      label = "Select a year",
      choices = unique(penguins$year),
      selected = 2009
    ),


    #create dropdown selection for var on x-axis
    varSelectInput(
      inputId = "var_x",
      label = "Select x-axis",
      data = penguins,
      selected = "bill_length_mm"
    ),

    #create dropdown selection for var on y-axis
    varSelectInput(
      inputId = "var_y",
      label = "Select y-axis",
      data = penguins,
      selected = "body_mass_g"
    ),

    # Add button to download figure
    downloadButton(outputId = "save_fig",
                   label = "Download figure"),

    # Add download link for full dataset
    downloadLink(outputId = "save_data",
                 label = "Download brushed penguins dataset")

  ),

  # Main panel content
  h3("Exploration of Palmer penguins data"),

  plotOutput("biplot", brush = "plot_brush"),
  dataTableOutput("tbl")

)


#####################
### Define server ###
#####################

server <- function(input, output, session) {

  # Create reactive object for filtered penguins data
  penguins_filt <- reactive({
    penguins |>
      filter(species %in% input$spp,
             year == input$year)
  })


  ### Output in app ###

  # Create reactive object for ggplot fig
  fig <- reactive({
    ggplot(penguins_filt()) +
      geom_point(aes(!!input$var_x, !!input$var_y, color = species), size = 2, alpha = 0.75) +
      scale_color_brewer(palette = "Set1") +
      theme_bw(base_size = 20)
  })

  # Create biplot based on selected variables
  output$biplot <- renderPlot({
    fig()
  })

  # Create table from brushed points on plot
  output$tbl <- renderDataTable(
    brushedPoints(penguins_filt(), input$plot_brush),
    options = list(pageLength = 5)
  )


  ### Output to download ###

  # Code to export figure upon clicking download button
  output$save_fig <- downloadHandler(
    filename = "example_fig.png",
    content = function(file) {
      ggsave(file, plot = fig(), device = "png", width = 6, height = 4, units = "in")
    }
  )

  # Code to export data upon clicking download link
  output$save_data <- downloadHandler(
    filename = "penguins_brushed.csv",
    content = function(file) {
      readr::write_csv(brushedPoints(penguins_filt(), input$plot_brush),
                       file)
    }
  )

}


###############
### Run app ###
###############

shinyApp(ui, server)